Created by
Teemu Pekkanen
All Rights Reserved
2010
Purpose of this project is to find new methods of finding factors and prime numbers. I had read about difficulties of finding huge prime numbers and factors from a book called "Minds, Machines and the Multiverse. The Quest for the Quantum Computer, by Julian Brown" Anyway, this subject arised a thought about visualization of the decimal parts somehow. Actually I found two ways to make the same result.
I recommend you to download freeware math program Scilab. It is much similar to Matlab. All scripts are made for Scilab, but if you are an experienced user of Matlab, I believe you are able to convert these simple scripts. This program is downloadable from http://www.scilab.org.
First we begin to examine relations between decimal parts of divided values. We start with dividing the "result of the integers" with integer value. Our objective now is to find two integer values, that is the result of the integers, or to find out that there are no such factors.
I use a small value for example of finding factors. Let's begin with a value 111. If we start from dividing with 1, and then adding a one integer after that, we have a curve, where decimal value is between one and zero.
Here is the code that made the previous curve:
-----------------------------------
code=111;
x = 1;
limit = code;
while x <= limit,
division = code / x,
rounding = int(division),
final = division - rounding,
sheet($+1) = final,
x = x + 1,
end,
plot2d (sheet)
-----------------------------------
Explanation:
"code" can be any positive integer. This is the value we want to "crack".
"x" is the the first factor, a value that determines the value the counting begins. . Usually this is either 1 or "int(sqrt(code))". Factors x*y = y*x are equal, and therefore it is enough to count values forward from the "culmination point". This point is the integer square root value of the "code". So the closest integer factor of culmination point is "int(sqrt(code))".
"limit" determines how long the counting keeps going. This can be a integer value or factor dependant to "code" value, such as "code" divided with integer value. Optimal maximum limit is "code", since it consists all the factor pairs.
"while x <= limit;" begins the loop that repeats itself until value x is more than "limit".
"division = code / x;" creates the second decimal number factor.
"rounding=int(division);" takes the integer value.
"final=division-rounding" takes the decimal part to "final".
"sheet($+1) = final," takes decimal value to the list memory.
"x = x + 1," takes the step to the next factor. Value "1" is added to "x" after every time when when script has gone through.
"plot2d (sheet)" makes the visual plotting of the (sheet) list.
There is a simplified version below:
------------------------------------
code = 111;
x = 1;
limit = code;
while x <= limit,
sheet($+1) = (code/x)-int(code/x),
x = x + 1,
end,
plot2d (sheet);
-------------------------------------
In next section we make curve possible to go farther than between one and zero:
---------------------------------
code=111;
x = 1;
limit = code;
division = code / x;
rounding = int(division);
final = division - rounding;
sheet($+1) = final;
prev = final;
x = x + 1;
gap = 0.5;
level = 0;
while x <= limit,
division = code / x,
rounding = int(division),
next = division - rounding,
if next > prev + gap then level = level - 1; elseif prev > next + gap then level= level + 1; end,
final = next + level,
sheet($+1) = final,
x = x + 1,
prev = next,
end,
plot2d (sheet);
---------------------------------
More compact version of the code:
-------------------------------------
code=111;
x = 1;
limit = code;
final = (code/x) - int(code/x);
sheet($+1) = final;
prev = final;
x = x + 1;
gap = 0.5;
level = 0;
while x <= limit,
division = code / x,
rounding = int(division),
next = (code/x) - int(code/x),
if next > prev + gap then level = level - 1; elseif prev > next + gap then level= level + 1; end,
final = next + level,
sheet($+1) = final,
x = x + 1,
prev = next,
end,
plot2d (sheet);
-------------------------------------
"prev = final;" Beginning is the same as in the previous example as far as "prev". "Prev" made for comparison and counting "level", what is explained further. This part also prepares a comparative value to the "gap" count.
"gap" is a "default value 0.5" that determines if the "level" should be rised. "next" and "prev" are computational values, and lowering and raising the "level" is done by using them. When the "next" is bigger than "prev" plus the "gap" value of 0.5 below, this means that curve should rise to the lower "level". If "prev" is bigger than "next" + "gap", then it raises the value of the "level" by one.
The rest of the script is about listing the decimal value, as was done in the previous example.
The squareroot point in this case is important for creating identical curve, except fot its size. All that is needed is to enter x value as follows:
x = int(sqrt(code));
It is important to define certain "limit" to keep shapes of the curves similar. Here below is the "code" 111 and "limit" = x * 2.

Here below the "code" is 111111.
Here below the "code" is 111111111.
If it is possible to find a formula that represents easily the curve, this might solve the problem with finding factors of huge values and finding huge prime numbers.
The growth of value 10^n is linear at least in the beginning. In the picture above the highest code value is "100 000 000" and x = int(sqrt(code));
limit = x * 2;.
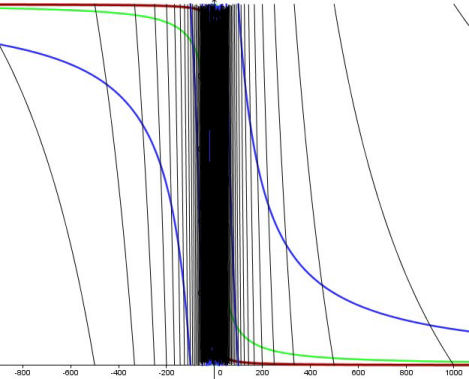
This image demonstrates the difference between values. Red is value "1", green is value "10", blue is value "100" and black is value "1000".